The first benchmark unit this pipeline ever attempted, before any of the units that were later accepted, reported full completion in 114 seconds. The Coder passed on its first try, every gate went green, and the Reviewer approved. Then the benchmark’s own hidden test failed it. The pipeline had written a wrapper around an existing method, and inside that wrapper it called the method by name. Then it pointed that same name at the wrapper, so the wrapper called itself, again and again, until Python gave up.
Every stage did what it was built to do and the verdict was still wrong, because three separate checks were weak at the same time. Any one of them working properly would have caught the bug.
The tests the pipeline wrote checked that the wrapper existed without ever calling it, so the bug never got the chance to show itself. The check that matches each acceptance criterion to a test compared words rather than behaviour, and the words matched fine. The mutation gate breaks the committed code on purpose and requires the test to notice, and it found nothing in this change it knew how to break. An earlier post described that gate recording a skip when it has no way to judge a change. Here it reported a pass instead, which everything downstream reads as a certified result.
I had suspected all three for months and never caught any of them. Catching them takes a verdict from outside the pipeline, and that is what moving the work onto LoopsBench brought in. LoopsBench is Microsoft’s long-horizon coding benchmark: every task breaks into units that arrive with their own requirement and their own hidden tests, and the pipeline never sees the tests that grade it.
Fuzzing a pipeline by changing where its work comes from
A while ago I swapped one model for another and more than twenty hidden bugs fell out of my own code. Running the same code against the same model over and over goes deep on one path and never goes wide. Changing where the work comes from does the same job from the other side.
Everything the pipeline assumed about what a project looks like was tuned against targets I picked myself. Nobody writes down an assumption they have never seen broken.
Twelve days of external targets produced this. The unit counts are per window and add up to twelve; the defect counts run cumulatively from 15 August.
| window | units accepted | defects filed (cumulative) |
|---|---|---|
| 15 to 18 August | 2, on separate tasks | 33 |
| 15 to 27 August | 10 more, all chained onto one task | 145 |
What a new target supply kept turning up
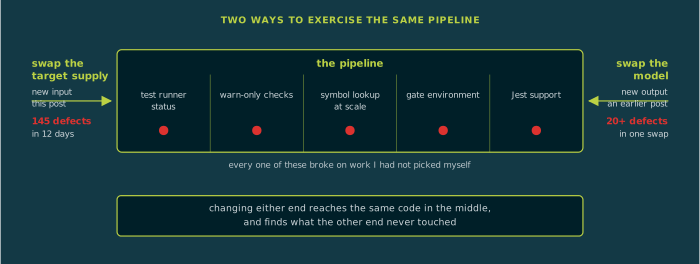
The step that runs a target’s test suite always handed back success, whatever the tests actually did. The real pass and fail counts were right there in its output, but the status its callers read was green every time, including the last full-suite check before a session closes. A gate that can never report a failure certifies nothing.
Four other checks could report a problem and then do nothing about it, which I argued against before and ran into again within a week. One of them misread a test run as a broken harness and switched off the check that each written test exercises its criterion, so five already-green tests shipped behind it without a word. Turning those warnings into refusals only helped once each refusal named the stage that repairs what it rejects.
One helper answered a simple question, whether a symbol exists, by loading the entire symbol table every time it was asked, which nobody notices on a target with a few hundred symbols. On the first target with 26,000 symbols, the same question asked in parallel across many names read 14 GB and spent 15 minutes on a step that should take under a second. Nothing anywhere reported that this was happening, so the only symptom was time.
The Test Writer copied the target project’s own import style, a path alias the project’s test config knows how to resolve. The type check ran without that config, decided three imports pointed nowhere, and blocked a test file the real test runner would have loaded without complaint. The file was fine and the checking setup was wrong, so that mismatch now warns instead of blocking.
Adding support for Jest took three changes, not the two I had planned for, and the one I missed decides where a new test file should live. Without it, every Jest run would have passed for the wrong reason: no tests found, so nothing to certify. My own TypeScript targets all use Vitest. The benchmark has no Vitest projects at all, and its JavaScript half runs on Jest and Mocha.
Four attempts at the same unit in one day
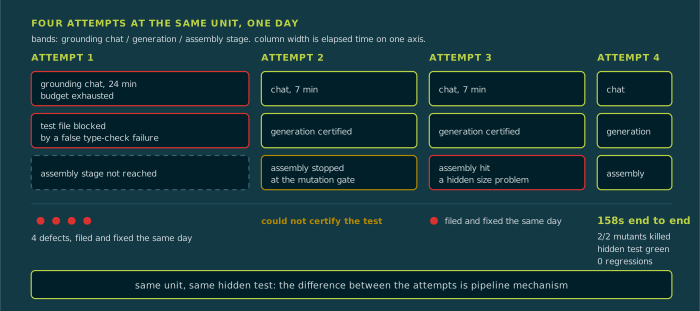
The first attempt at one unit failed in four ways. The pipeline worked out the wrong set of files to touch. The grounding chat then spent 24 minutes arguing with that wrong set. The test file was blocked by the false type-check failure above. The repair step ran against a working copy that no longer existed. All four were filed and fixed the same day.
On the second attempt the chat settled in 7 minutes and the tests passed their checks, and the run stopped only because the mutation gate could not see through the test well enough to certify it. The third attempt set off the size problem above, also fixed that day. By the fourth, the unit ran start to finish in 158 seconds, both planted bugs caught, the hidden test green, nothing else broken. The distance between the first attempt and the fourth came entirely from changes to the pipeline: each attempt’s failure became the next attempt’s repair.
Across units rather than within one, the failures get less serious. The early ones killed a run outright; the later ones cost an attempt or turn out to be noise. New findings keep landing in categories that already have a name, and the second case in a category costs far less than the first: one unit settled its chat on the first try in 194 seconds, where the first of that kind took nine attempts, escalating to a more expensive model along the way. A fuzzer is only worth running if what it finds gets cheaper over time, and that is measurable, though not cleanly here, because the later units could simply have been the easier ones.
What this does not prove
Ten units are now accepted onto one task’s shared main, ten of its 76 requirements, and every earlier unit’s tests keep running as each new one lands. The two earliest accepts, the ones from the first window above, sit on other tasks, which makes twelve in all. That is one growing branch of one task, not a score. No run has walked a task’s full dependency graph yet, and I picked the units myself. Nothing here is a controlled measurement. An earlier post called a code freeze the one hard rule when grading one model against another, because repairing a defect partway through turns the comparison into one between two different pipelines. These attempts are the opposite exercise, and the pipeline changed under them the whole time.
A good share of the TypeScript and Jest findings come from a test runner and a project layout I had not chosen myself. The pipeline has run plenty of TypeScript, all of it on Vitest projects I set up, and these would have turned up on any serious Jest project.
If only one kind of input has ever gone through a code path, everything the system assumes about that path is untested, whether or not it happens to be true.
I already believed that about the models the pipeline calls. It took a referee I do not control to make me believe it about the projects the work arrives from.
Runs are on LoopsBench, 15 to 27 August 2026, Python and TypeScript units across pytest and Jest, dataset 84ae415, harness commit 5880b64. Defect counts are entries in the project’s own gap catalogue over that window, one of them later retracted. Task data is canaried against training corpora and is not reproduced here, in prose or in any image.