The test output was specific:
FAIL tests/posts.test.ts
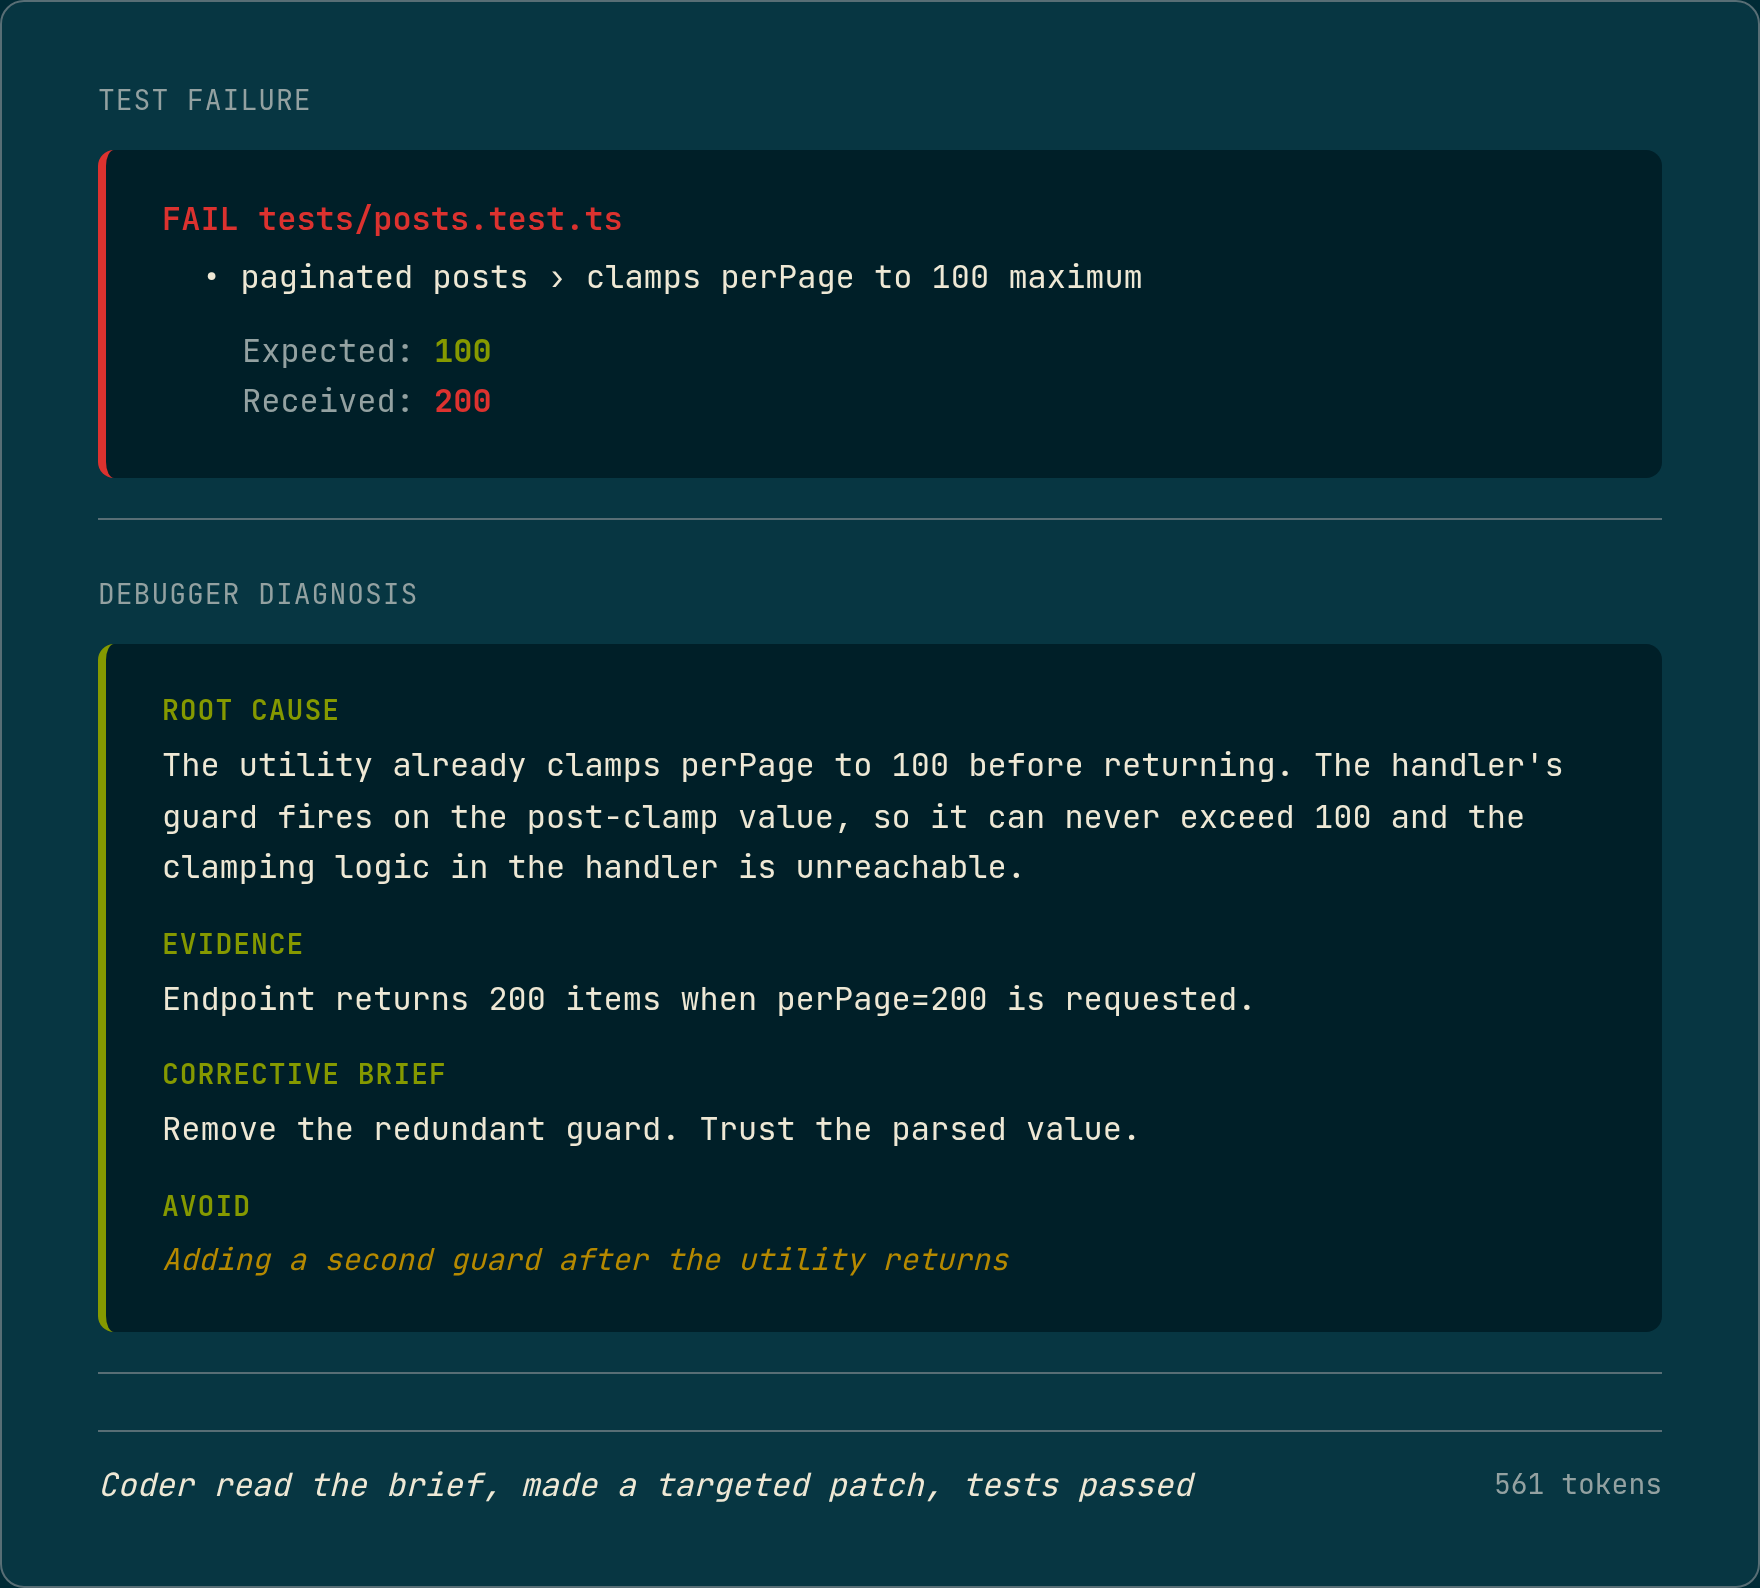
● paginated posts › clamps perPage to 100 maximum
expect(received).toBe(expected)
Expected: 100
Received: 200The Coder had written a handler that accepted a perPage parameter, clamped it at 100, and returned paginated results. The guard was there. The logic looked correct. The test said it was not.
The Debugger’s diagnosis was specific: the parsePaginationParams utility already clamps perPage to 100 before returning, so the handler’s guard fires on the post-clamp value and can never trigger. The endpoint returns 200 items because the guard is unreachable. The corrective brief: remove the redundant guard and trust the parsed value.
561 output tokens. The Coder read the brief, made a targeted patch, the tests passed. That is the Debugger’s job.
// pages/api/posts.ts
  const { page, perPage } = parsePaginationParams(req.query)
- if (perPage > 100) {
-   return res.status(400).json({ error: 'perPage max is 100' })
- }
  const posts = await getPosts({ page, perPage })
What the Debugger receives
The Debugger’s inputs are fixed:
- The manifest: the ticket’s declared scope, files, and acceptance criteria (produced by the Planner, whose accuracy depends on knowing the blast radius)
- The test file: the full content of the failing test suite
- The test output: the exact failure from the most recent run
- The last implementation the Coder wrote
- The attempt history: what the Coder tried on previous passes
The Debugger can see the code the Coder produced on each attempt. What it cannot see is the Coder’s reasoning: the chain of thought, the assumptions, the decision process that led to each attempt. That is intentional.
An agent that inherits another agent’s reasoning inherits that agent’s wrong assumptions.
If the Coder convinced itself that the problem was in the import path, and the Debugger reads that reasoning, it will be pulled toward the same conclusion. The Debugger starts from the test output and the code on disk, not from a narrative the Coder constructed about why its approach should work.
The other bound is the codebase itself. The Debugger does not receive the full project, only the files the manifest authorizes. It cannot look outside that scope to explain the failure. An agent with the full codebase will find explanations that are plausible but not relevant. The manifest scope forces the diagnosis to stay grounded in what the Coder was actually working on.
The output is structured JSON. The schema is not ceremonial. An agent asked to produce free-form diagnosis will produce free-form diagnosis: observations, possibilities, suggestions. Structured output forces a specific claim (“the guard fires on the post-clamp value”) instead of a general one (“there may be an ordering issue in the validation logic”). The Coder can act on the first. The second produces another Coder attempt that guesses.
Structural failures and logic failures
The Debugger is for logic failures. It is not for structural ones, and the distinction matters.
A structural failure is a type error, a missing import, a function called with the wrong signature, a caller that was not updated when an interface changed. The cause is a gap in scope or a resolved-name mismatch. These do not require reasoning about what the code does. They require knowing what the code references. The language server handles these before the test suite runs. A diagnostic pass runs between every Coder write and the tests. Import errors and type mismatches get fixes applied in-place, without spending a Debugger pass.
What reaches the Debugger is a logic failure: the code is structurally correct, the types check, and the tests still fail because the implementation does the wrong thing. The perPage clamping example is a logic failure. The guard was present, the types were correct, the logic was wrong.
That separation matters for the retry budget. A Debugger pass costs a full inference cycle. Before LSP, Debugger passes were spent on both categories: structural failures that a diagnostic pass would now catch automatically, and logic failures that actually need reasoning. Post-LSP, the Debugger is reserved for the second category. The budget goes further.
A second example
BLOG-009: migrate Post.tags from string[] to Tag[]. The Coder updated the type definition, updated the seed data, and updated the implementation. The type migration was correct. The tests failed with a TypeScript error:
tests/posts.test.ts:124:24 - error TS2345:
Argument of type 'string' is not assignable to parameter of type 'Tag'.

124       expect(p.tags.includes('typescript')).toBe(true)
The Coder had changed the type. The existing tests had not been updated to match. They were still asserting p.tags.includes('typescript'), passing a string to includes() on a Tag[] array. TypeScript rejected it. Two errors, same pattern, different assertions.
The Debugger identified the mismatch: the tests were still asserting p.tags.includes('typescript'), passing a string to includes() on what was now a Tag[] array. The migration code was correct. The tests were written against the old string type and needed to match the new Tag object type. It also flagged reverting the type migration as an approach to avoid.
The fix was to the assertions, not the implementation. p.tags.includes('typescript') became a check against tag.slug. APPROVE on the next Coder attempt. 99,682 tokens total, 134 seconds.
This category of failure is worth naming separately: type migration consequence. The Coder changed the type and the data correctly. The existing tests were written against the old type. The Debugger caught the mismatch the Coder left behind.
What the Debugger cannot do
The Debugger cannot fix a wrong acceptance criterion. If the ticket says “return 404 when post not found” and the acceptance criterion was written as “return 400 when post not found,” the Debugger will diagnose the implementation as correct and flag the test as wrong. That is accurate, but it is not what the Test Writer intended. That failure surfaces either at the Reviewer stage or not at all.
It cannot fix a test written against a wrong interface. If the Test Writer assumed a function signature that the implementation does not match, the Debugger will identify the mismatch. It cannot determine which side is authoritative.
It cannot recover from a Planner that scoped the wrong files. If the Planner missed a caller and the Coder’s implementation broke it, the Debugger will see a failing test for a file that is not in its inputs. It will flag that it cannot diagnose the failure. It does not have access to the broken caller. That failure surfaces as a pipeline halt, not a wrong fix.
The Debugger’s scope is exactly as narrow as the manifest scope. That narrowness is what makes it reliable.
An agent with unlimited reach will find a fix for any failure, including the wrong ones. The Debugger can only fix what is inside its authorized scope, and it can only explain failures using evidence the test output provides.
For failures outside those bounds, the Reviewer is the backstop. The Debugger is not trying to cover every failure mode. It is trying to cover the failure mode it can actually verify: logic errors in correctly-scoped, structurally-valid implementations.
The failures described in this section (what the Debugger correctly classifies but cannot repair) are what the Debugger router addresses in the next architectural step. The diagnostic scope described here has not changed. What changed is what happens after the classification: a wrong-test or wrong-manifest diagnosis now routes to an operator correction surface rather than producing more Coder attempts against a problem the Coder structurally cannot solve.
The pipeline runs inside Docker on real tickets. Numbers are from actual runs against a TypeScript blog API fixture. The pipeline is still R&D. The Debugger’s evidence-quoting requirement catches most logic failures, but there are classes of failure it will not diagnose correctly, and the Reviewer stage exists partly for that reason.