Every run produces an outcome: pass, fail, or timeout. The outcome is not the interesting part. What a stage reasoned about before producing its output, which operations it attempted and in what order, where the token budget went, and at exactly what point something diverged from the expected path: none of that is in the output. It is in the run logs, or it is nowhere.
The 248-run analysis was only possible because every run was logged in enough detail to attribute failures to specific manifest fields after the fact. Without that archive, the result would have been a pass rate with no explanation for why the failures were distributed the way they were. The structured run log is what turned a pass/fail count into a diagnostic breakdown.
What gets persisted per run
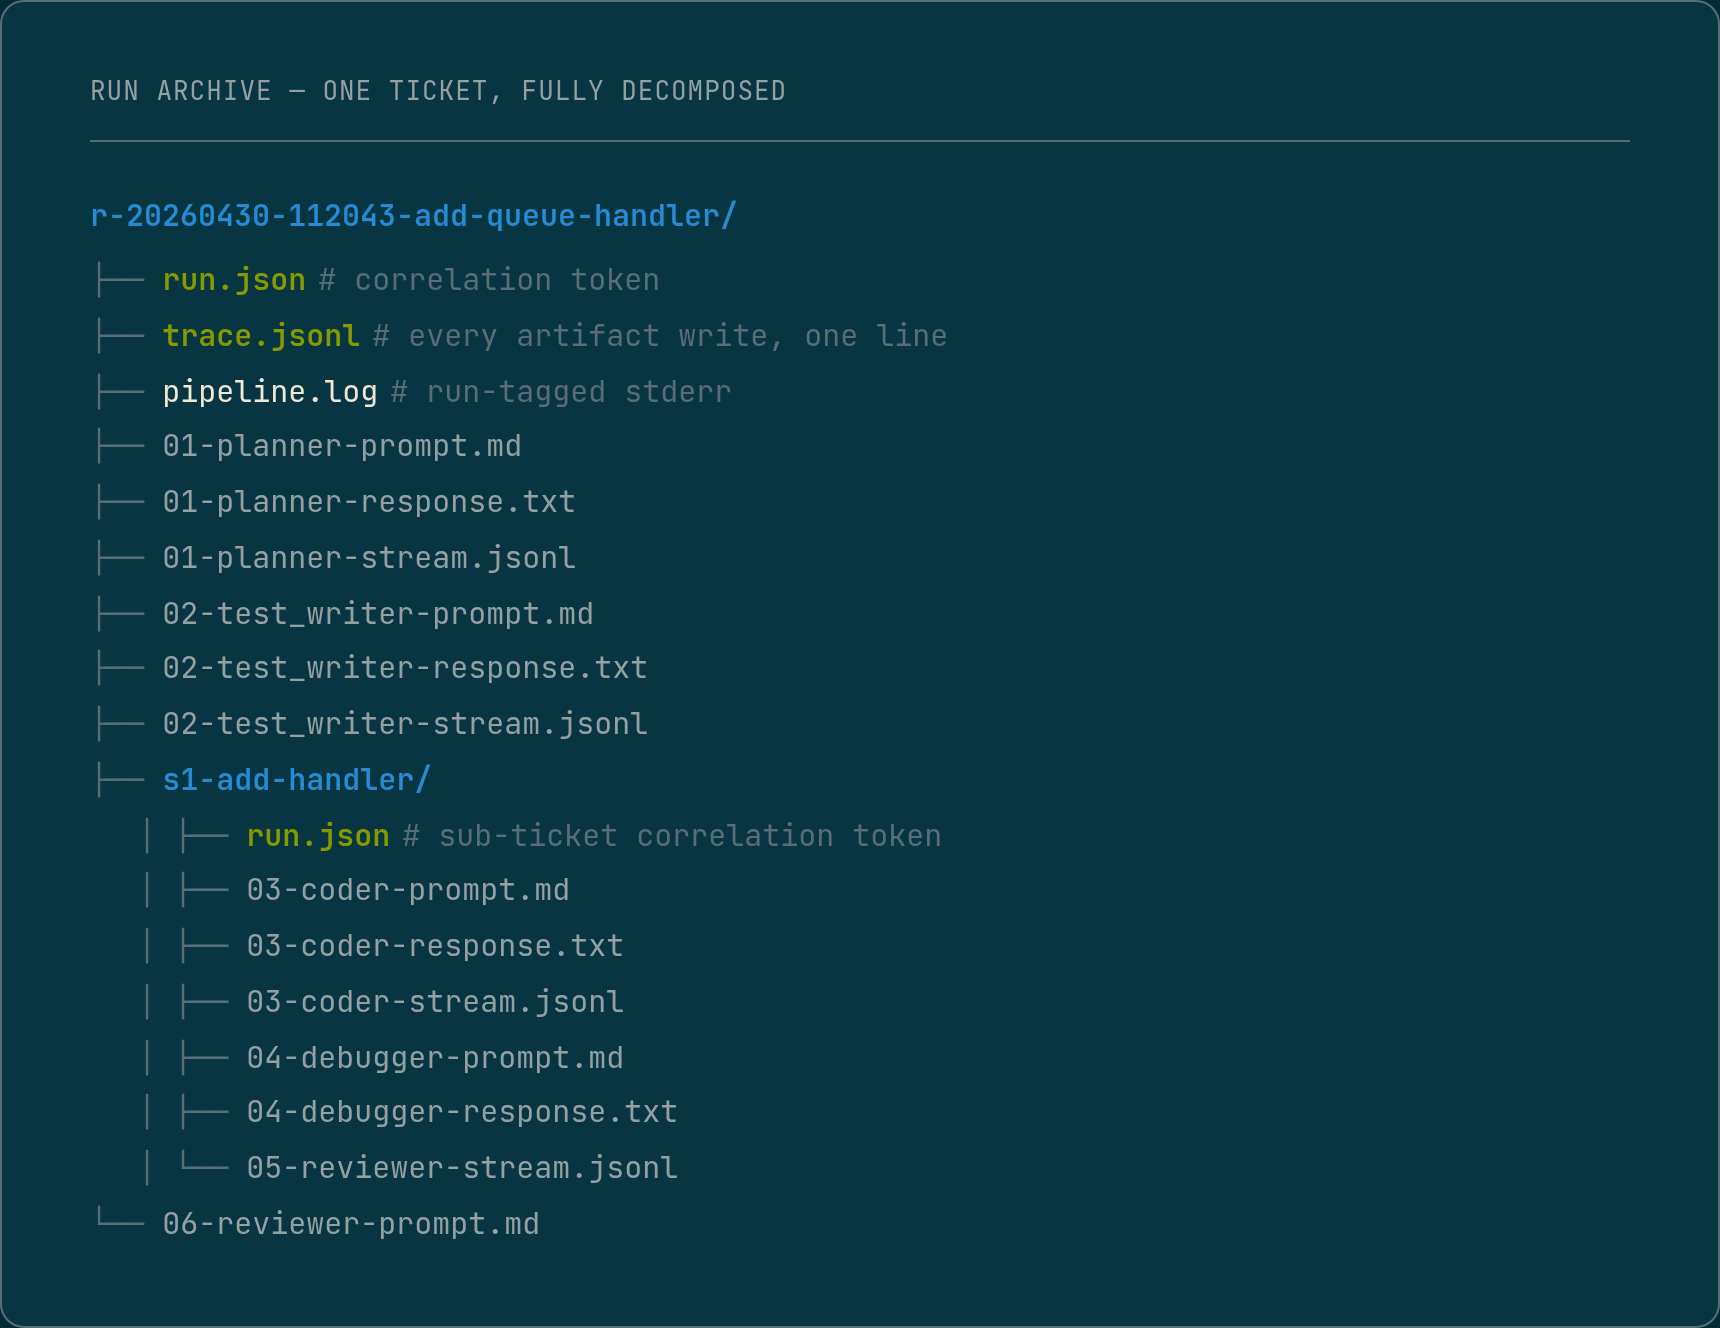
Every stage in the pipeline writes to the run archive before it exits.
The archive is not a side effect. It is a first-class output, the same way the generated code is.
Each stage entry contains: the full prompt context, the model’s response, token counts broken down by input, output, and cache, the wall-clock time the stage took, and for stages that perform structural operations against the codebase, a record of each operation attempted, the outcome of each, and any rejection reason the underlying tool returned.
For models that surface a reasoning trace, that trace is also persisted separately from the response. The model’s visible output and the model’s reasoning are not always the same document.
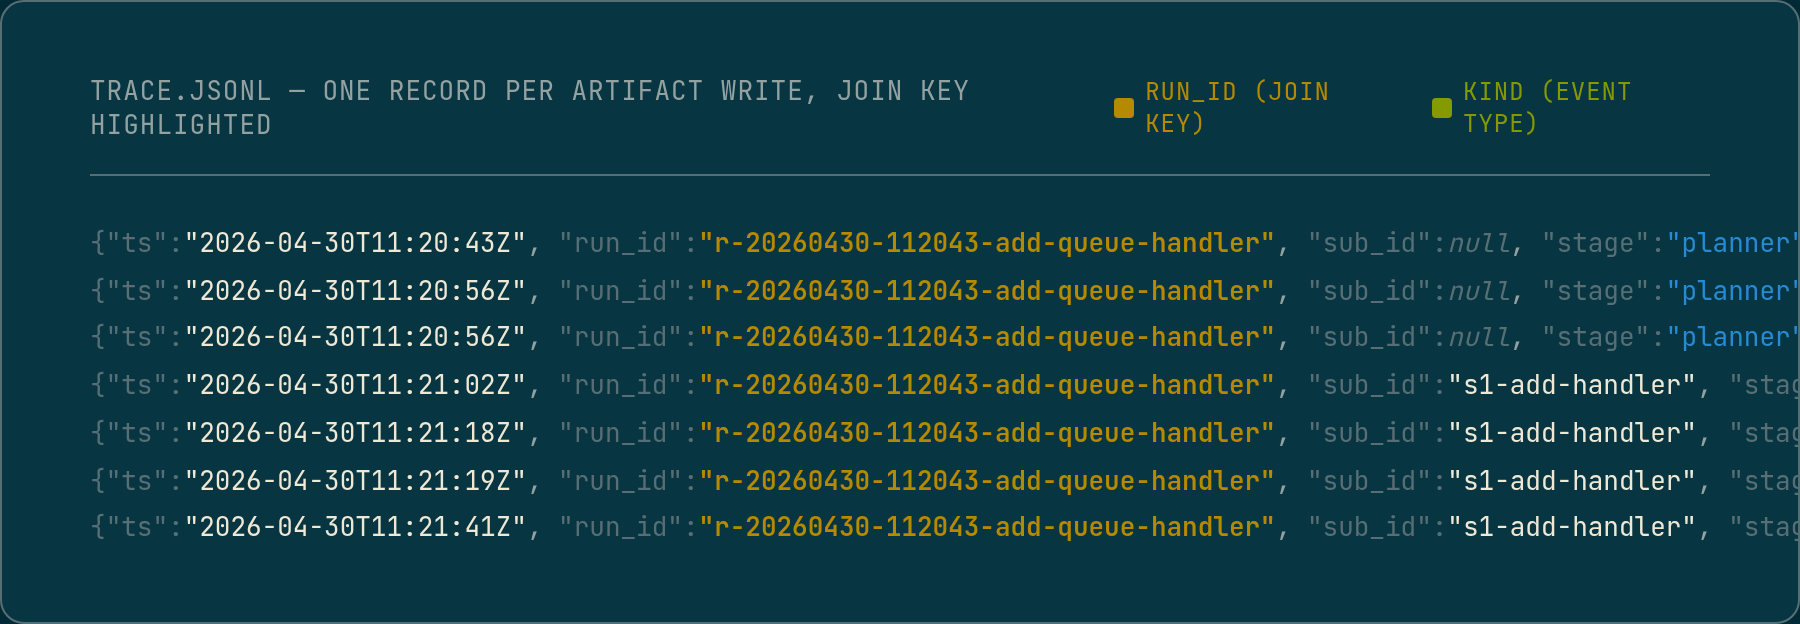
Every record across every stage carries a stable, sortable correlation token minted at pipeline start. The same token appears as the run directory name, in the run metadata at the root, in every log line, and in every structured event record. Decomposed runs add a sub-ticket identifier alongside, so a single log entry identifies exactly which sub-ticket of which run produced it. That is what makes the archive queryable across hundreds of runs: the correlation token is a join key, a directory name is not. One query against the event stream returns a ticket’s full execution across every stage and sub-ticket; a second reconstructs the stage call tree.
The concrete example: what the trace showed that the output did not
During ticket generation, the stage has access to registry tools: live lookups against the registry, route discovery, call-graph queries. The ticket is supposed to be grounded in those results. The visible output, the ticket itself, reads as grounded: it names specific routes, references specific symbols, describes operations against real types.
The reasoning trace from the same stage told a different story. Early in the reasoning, the model attempted a registry lookup and received no response. Rather than surfacing a failure, it noted internally that the tools were unavailable and pivoted: it would use only what was already present in the prompt context. The rest of the reasoning then proceeded on that basis, filling in symbol names and route paths from inference rather than from live data.

The ticket the stage produced looked valid. The trace showed it was constructed from a fallback the model chose silently, without any signal in the output that the grounding had changed.
That is the observability gap. The output is a finished document with no record of how it was assembled. The trace is where the assembly is visible, including the moments where the model departed from the intended path.
Why output alone cannot identify hallucination patterns
A hallucinated field in a manifest looks identical to a correct field in the output. Both are plausible strings. The difference is visible only when the Coder attempts to act on the field and hits a wall: a symbol that does not exist in the file the manifest named, a type with a different declaration kind than the one specified, a function signature that does not match the one the test was written against.
At that point the useful signal is in the Coder’s operation log, not in the test failure message. A test failure says something is wrong. The operation log says which specific structural edit was rejected, on which file, for which symbol, and what the Tree-Sitter driver reported as the reason. That is the difference between knowing a field was wrong and knowing which field, where it came from, and what a correct value would have looked like.
The post on why the Debugger never inherits the Coder’s reasoning describes the input contract the Debugger requires to diagnose accurately: it needs the raw operation log from the failed Coder attempt, not a summary, and certainly not just the test output. That is what the Debugger’s input contract is built on.
How the 248 runs became an analysis
The 248-run breakdown, which classified failures into first-pass completions, Debugger recoveries, Debugger-diagnosed failures, and pre-Coder stalls, required a run archive queryable by failure class. That is not achievable from pass/fail outcomes alone.
Each run in the archive has a structured record of which stage failed, what the Debugger diagnosed when it ran, and for the failures it could diagnose in detail, which manifest field class the diagnosis pointed to. Querying that across 248 runs produces the field-level breakdown. Without it, the data exists only as a collection of failed runs with no attributed cause.
The same archive is what makes before-and-after measurements meaningful. When a manifest field is moved from LLM-emitted to machine-extracted, the change should be visible as a reduction in the failure class associated with that field. If the logs do not record which fields were involved in which failures, the measurement is not possible.
The limit of logging as a diagnostic tool
Logging is telemetry, not enforcement. It records what happened after the fact. A run that completed with a valid-looking ticket, where the reasoning trace showed the model silently fell back to inference, still passes. The log surfaces the event. It does not prevent it.
The structural fix for that specific failure class is better than better logging: if the registry tools are unavailable the stage should surface a hard failure rather than continuing on degraded grounding. But finding and characterising that failure class in the first place required the trace. Prompt rules and output validators operate on the visible output. The trace is what lets you see the class of failure that produces outputs that are plausible but wrong.
Output quality, what was generated, whether it compiled, whether the tests passed, is a reasonable place to look, but it is not where the interesting diagnostics live. A run that produced passing tests on first attempt is not necessarily a well-behaved run. A run that triggered the Debugger, diagnosed a bad manifest field, re-planned, and produced passing tests on the second attempt is actually more informative about what is working and what is not.
The pass rate is an outcome metric. The run archive is the process record. Both matter, and they tell different things.
What the archive enables going forward
Per-run token cost, broken down by stage, is computable from the archive. That is what will eventually make a computed token cap viable: enough logged runs on a consistent project to fit a model to the actual distribution. What the Planner costs on this codebase for this ticket complexity class. What the Coder costs on retry versus first attempt. Those distributions live in the archive, not in any single run’s output.
The aggregate picture, across hundreds of runs, is where the pipeline’s real behaviour becomes visible. Each individual run tells you what happened on that ticket. The archive tells you what is happening to the pipeline as a system.
The pipeline runs inside Docker on real tickets against a ~100k line TypeScript monorepo. Still R&D. The run archive is the primary diagnostic surface. Structured logging is load-bearing infrastructure, not instrumentation. Off-the-shelf tracing (OpenTelemetry, vendor SDKs) is a deliberate non-choice while the pipeline shape is still in flux: every dependency on an external trace schema is one more thing to migrate when the architecture shifts. JSONL plus jq does the analyses described above at zero lock-in; swapping the writer for an OTel exporter once the architecture stabilises is a one-file change.